Area Overview for Castell-nedd Port Talbot - Neath Port Talbot
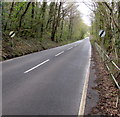
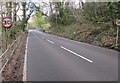
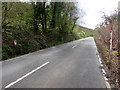
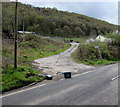
Photos of Castell-nedd Port Talbot - Neath Port Talbot
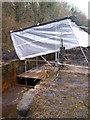
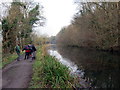
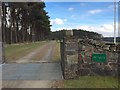
22 photos from this area
Area Information
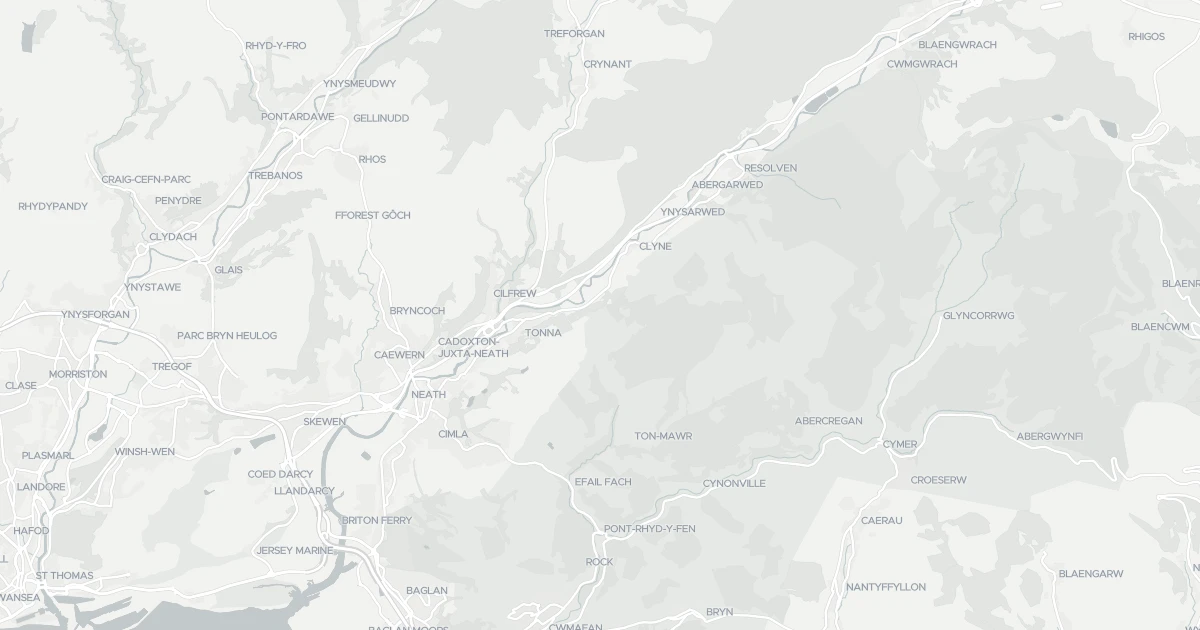
Living in Castell-nedd Port Talbot - Neath Port Talbot means settling into a large local authority district that covers 451.9 km². This significant land area defines the boundaries of daily life for residents across the borough. You navigate a region that functions as a distinct administrative entity within Wales, offering a wide scope for living arrangements. The sheer size of the district suggests varied landscapes, though specific geographical details remain outside the current record. Most households here are established. You will find that 67% of people own their homes, indicating a community where stability is a common feature rather than a trend. This high rate of ownership points to an area where families and long-term residents form the backbone of the local population. The demographic profile reveals a mature community, as the median age sits at 70 years. This statistic suggests that the area is increasingly populated by older adults, which shapes the local services and social environment you would encounter. When you consider homes in Castell-nedd Port Talbot - Neath Port Talbot, you are entering a space defined by these broad structural facts. The area does not offer small parks or distinct neighbourhoods in the data profiles, yet the vast 451.9 km² footprint provides ample room for individual living spaces. You are looking at a substantial district where property decisions rest on the practical reality of the area's larger scale.
Area Type
District/Borough
Area Size
451.9 km²
Population
Not available
Population Density
Not available
Area Report
Crime & Safety
Medium crime
At 72 out of 100, this area has low crime, above the England and Wales average of 58 (higher is safer). The score has risen in the 12 months to April 2026, so the area is getting safer. The most reported crime here is violence and sexual offences.
Safety score
72 / 100
Low crime
National average
58 / 100
14 points safer
Most common
Violence and sexual offences
12 in April 2026
Recent trend
Improving
Area getting safer
Crime map
Interactive
This map shows where the police have recorded crime near the property. Open it to filter by crime type and time period.
Safety trend
Improving
The safety score tracks recorded crime month by month against the regional and national average, where higher is safer. In this area it has climbed from 67 to 72 out of 100 in the 12 months to April 2026, so less crime is being recorded and the area is getting safer.
Local
Reported crime by type
41 reported
These are the crimes the police recorded in this area in April 2026, by type. Violence and sexual offences was the most common, with 12 of 41 reports. This counts reported crime only, so the real figure may be higher.
Violence and sexual offences
12
Anti-social behaviour
8
Vehicle crime
6
Criminal damage and arson
4
Other theft
3
Burglary
3
Public order
2
Shoplifting
2
Bicycle theft
1
Compared with the national average
14 points safer
This compares this area with the average for England and Wales, crime type by type. A green shield means that type is less common here than average; red means more common. Overall this area scores 72 against 58, 14 points safer than the national average.
Crimes recorded per 1,000 people in the latest month on record. Green is safer, red is higher than average.
Medium crime around Castell-nedd Port Talbot - Neath Port Talbot
Plus reveals the safety score for this exact area, the recent 12-month trend and the offence-by-offence breakdown against the national average.
Safety score for this exact neighbourhood
Recent trend, month by month
Offence-by-offence breakdown
How it compares with the national average
Plus subscription · cancel anytime
Planning
What is being applied for and built around Castell-nedd Port Talbot - Neath Port Talbot.
Demographics
The community in Castell-nedd Port Talbot - Neath Port Talbot is defined by a distinctly older population structure. You will find that the median age across the district is 70 years. This figure places the area among the older regions, meaning you are likely to interact with mature residents in local shops, at community events, and throughout the borough. The data categorises the most common age range simply as Total, which reflects the overarching dominance of the senior demographic across the age distribution. Home ownership stands as the primary form of accommodation in this district. A solid 67% of households own their properties, a proportion that signals a long-term community with deep local roots. This high ownership rate suggests that many current residents have been staying in the same homes for decades. Consequently, the social fabric is woven from established families and individuals who have chosen this location for its permanence. The household composition and accommodation types within the district reflect this stable pattern. While specific breakdowns of single-person versus family households are not detailed in the current records, the overarching 67% ownership figure paints a clear picture of the market. Deprivation and ethnic diversity are noted in the broader dataset, but the specific figures for these metrics are not included in the provided information. Your focus here is on the clear reality of an area dominated by older, owner-occupied homes.
Household size
Two person
Most common
Accommodation type
Houses
Most common
Home ownership
67%
Of households own their home
Median age
47 years
Across all residents
Age range
Adults (30-64 years)
Most common
Household composition
Single family household
Most common
Ethnic group
White
Most common
Religion
No religion
Most common
Household deprivation
41%
Of households have no deprivation dimensions
NS-SEC
17%
In lower managerial occupations
Air Quality
Pollutant levels, the official index and health context for Castell-nedd Port Talbot - Neath Port Talbot.