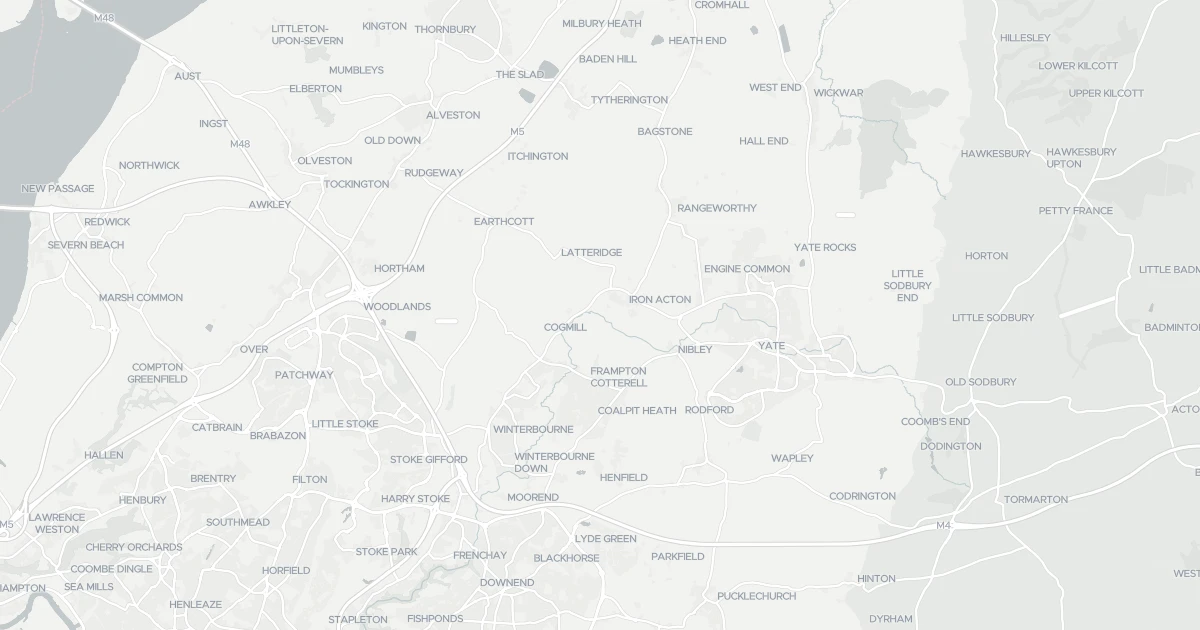
South Gloucestershire stands as a distinct local authority district covering 537.1 square kilometres in England. This significant landmass offers a wide range of living environments, from established suburban settings to semi-rural locations. You will find a community shaped by specific demographic realities rather than transient trends. The area does not contain Areas of Outstanding Natural Beauty, which allows for more straightforward planning in certain zones, though it does intersect with protected natural spaces. Daily life here is defined by a high proportion of long-term residents who have put down roots. Prospective buyers should understand that you are entering a market where stability is the norm. The sheer scale of the district means competition from other localities does not necessarily drive up prices in every village. Instead, value is determined by specific neighbourhood characteristics and proximity to local amenities. You will encounter a mix of accommodation types spread across this substantial territory. The environment includes specific planning constraints that you must factor into your search for homes in South Gloucestershire. While the absence of AONB status suggests fewer planning hurdles than some rural districts, the presence of other protected sites adds complexity to development. Living in South Gloucestershire involves navigating a landscape where nature conservation intersects with housing needs.
Area Type
District/Borough
Area Size
537.1 km²
Population
Not available
Population Density
Not available
Area Report
Crime & Safety
Medium crime
At 72 out of 100, this area has low crime, above the England and Wales average of 58 (higher is safer). The score has risen in the 12 months to April 2026, so the area is getting safer. The most reported crime here is violence and sexual offences.
Safety score
72 / 100
Low crime
National average
58 / 100
14 points safer
Most common
Violence and sexual offences
12 in April 2026
Recent trend
Improving
Area getting safer
Crime map
Interactive
This map shows where the police have recorded crime near the property. Open it to filter by crime type and time period.
Safety trend
Improving
The safety score tracks recorded crime month by month against the regional and national average, where higher is safer. In this area it has climbed from 67 to 72 out of 100 in the 12 months to April 2026, so less crime is being recorded and the area is getting safer.
Local
Reported crime by type
41 reported
These are the crimes the police recorded in this area in April 2026, by type. Violence and sexual offences was the most common, with 12 of 41 reports. This counts reported crime only, so the real figure may be higher.
Violence and sexual offences
12
Anti-social behaviour
8
Vehicle crime
6
Criminal damage and arson
4
Other theft
3
Burglary
3
Public order
2
Shoplifting
2
Bicycle theft
1
Compared with the national average
14 points safer
This compares this area with the average for England and Wales, crime type by type. A green shield means that type is less common here than average; red means more common. Overall this area scores 72 against 58, 14 points safer than the national average.
Crimes recorded per 1,000 people in the latest month on record. Green is safer, red is higher than average.
Plus reveals the safety score for this exact area, the recent 12-month trend and the offence-by-offence breakdown against the national average.
Safety score for this exact neighbourhood
Recent trend, month by month
Offence-by-offence breakdown
How it compares with the national average
Plus subscription · cancel anytime
Planning
What is being applied for and built around South Gloucestershire.
Demographics
The community profile of South Gloucestershire reveals a very settled population. The median age of 70 indicates that you are predominantly buying into an area inhabited by older residents. This demographic reality shapes the local culture, community organisations, and the pace of daily life. You are looking at a society where multi-generational stability is common, rather than a dynamic influx of young professionals or families with very young children. Seventy-three per cent of households own their homes, creating a area where ownership is the standard lifestyle rather than the exception. This high level of home ownership suggests that you will find a stock dominated by properties suited to mature living needs. The household composition reflects this, with fewer shared accommodation ratios than typically seen in younger, urban-centric districts. Diversity data points to a total population mix, though specific breakdowns in the available figures do not highlight any single dominant ethnic group beyond the general total. Similarly, religious affiliation data covers the total population without isolating a specific majority faith. This broad demographic spread means schools near South Gloucestershire cater to a wide age range rather than a hyper-focus on early education. You are entering a neighbourhood where community ties are often deep, forged over decades of residency. The population structure dictates that local services and facilities are oriented toward an older demographic.
Household size
Family (3-5 people)
Most common
Accommodation type
Houses
Most common
Home ownership
73%
Of households own their home
Median age
47 years
Across all residents
Age range
Adults (30-64 years)
Most common
Household composition
Single family household
Most common
Ethnic group
White
Most common
Religion
No religion
Most common
Household deprivation
54%
Of households have no deprivation dimensions
NS-SEC
22%
In lower managerial occupations
Air Quality
Pollutant levels, the official index and health context for South Gloucestershire.
Is South Gloucestershire good for older residents?
Yes, the area is ideal for the older demographic. The median age is 70, reflecting a community where long-term residents dominate. With 73 per cent home ownership, you find a settled population rather than a transient one. This stability creates a neighbourhood atmosphere suited to those valuing quiet, established communities over rapidly changing urban trends.
Can I rely on internet speeds for working from home?
You should proceed with caution regarding fixed broadband. While mobile coverage is strong with a score of 85 out of 100, fixed broadband quality is low at a score of 22 out of 100. If streaming high-resolution video or transferring large files is part of your workday, you need to check specific fibre availability at your chosen address, as the district average may be insufficient.
What are the main environmental risks I should know about?
You must prioritise flooding checks immediately. Flood risk is critical with a score of 30.74, indicating high risk coverage across parts of the district. Additionally, the area contains Ramsar Wetland Sites and protected nature reserves, flagged with warning scores of 7.71. These environmental factors influence planning and could affect property value or insurance costs compared to areas without such designations.
Is the area safe from crime?
The district performs well regarding crime. Safety assessments pass with a score of 73 out of 100, placing the area below the national average for crime rates. This low crime risk makes it a viable option for families or individuals prioritising security in their daily neighbourhood interactions.