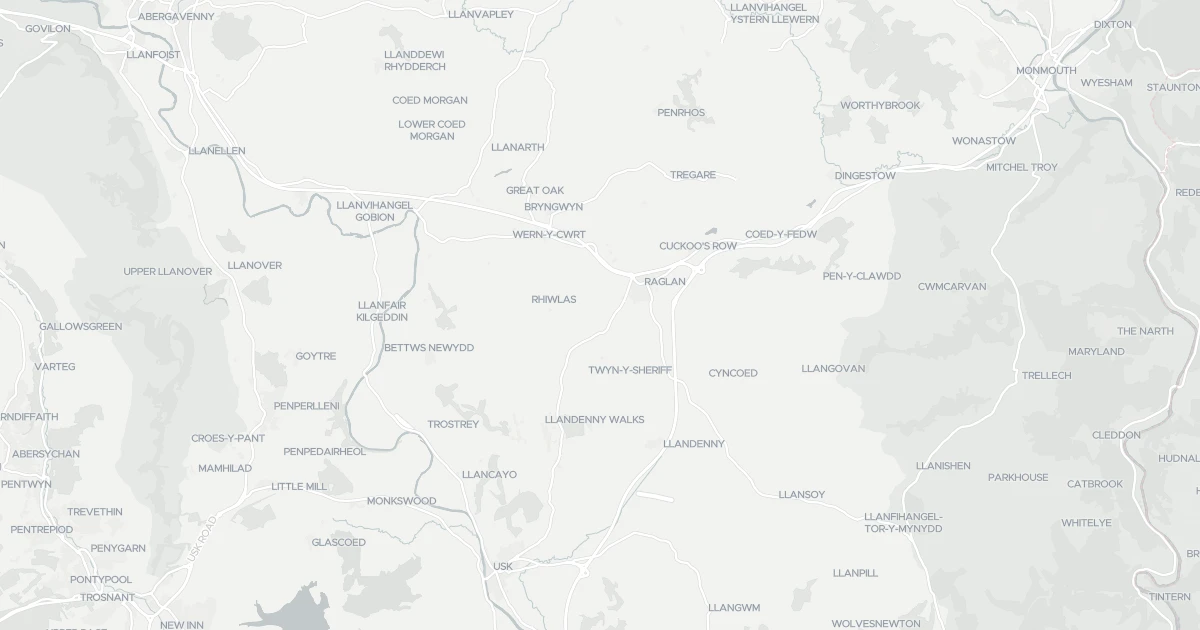
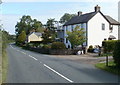
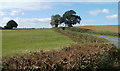
Sir Fynwy - Monmouthshire stands as a vast local authority district covering 886.6 square kilometres. This substantial land area defines a living environment where space is abundant, shaping the daily rhythm of life for residents throughout the region. The district operates as a unitary authority within Wales, providing a distinct administrative framework that separates it from neighbouring English counties. When considering homes in this expansive area, you are choosing a location where nature and open land dominate the landscape. The sheer scale of Sir Fynwy creates a setting that feels far removed from the density found in larger UK cities. Daily life here centres on a low-density lifestyle where the footprint of individual properties is dispersed across a wide geographical expanse. You will find that the community operates with a quiet independence, supported by the vast acreage under the council's management. The area's identity is rooted in its status as a significant geographical unit rather than a compact town or village. This spatial reality means that travel distances for accessing services often extend beyond the immediate boundaries of any single settlement within the district. Living in Sir Fynwy means embracing a wide-open canvas where the land itself plays a central role in the residential experience.
Area Type
District/Borough
Area Size
886.6 km²
Population
Not available
Population Density
Not available
Area Report
Crime & Safety
Medium crime
At 72 out of 100, this area has low crime, above the England and Wales average of 58 (higher is safer). The score has risen in the 12 months to April 2026, so the area is getting safer. The most reported crime here is violence and sexual offences.
Safety score
72 / 100
Low crime
National average
58 / 100
14 points safer
Most common
Violence and sexual offences
12 in April 2026
Recent trend
Improving
Area getting safer
Crime map
Interactive
This map shows where the police have recorded crime near the property. Open it to filter by crime type and time period.
Safety trend
Improving
The safety score tracks recorded crime month by month against the regional and national average, where higher is safer. In this area it has climbed from 67 to 72 out of 100 in the 12 months to April 2026, so less crime is being recorded and the area is getting safer.
Local
Reported crime by type
41 reported
These are the crimes the police recorded in this area in April 2026, by type. Violence and sexual offences was the most common, with 12 of 41 reports. This counts reported crime only, so the real figure may be higher.
Violence and sexual offences
12
Anti-social behaviour
8
Vehicle crime
6
Criminal damage and arson
4
Other theft
3
Burglary
3
Public order
2
Shoplifting
2
Bicycle theft
1
Compared with the national average
14 points safer
This compares this area with the average for England and Wales, crime type by type. A green shield means that type is less common here than average; red means more common. Overall this area scores 72 against 58, 14 points safer than the national average.
Crimes recorded per 1,000 people in the latest month on record. Green is safer, red is higher than average.
Plus reveals the safety score for this exact area, the recent 12-month trend and the offence-by-offence breakdown against the national average.
Safety score for this exact neighbourhood
Recent trend, month by month
Offence-by-offence breakdown
How it compares with the national average
Plus subscription · cancel anytime
Planning
What is being applied for and built around Sir Fynwy - Monmouthshire.
Demographics
The people residing in Sir Fynwy - Monmouthshire reflect a community with a notably mature character. The median age within this district has reached 70 years, indicating that the population consists largely of senior residents. This age profile suggests a neighbourhood where life pace slows, and property needs often centre on comfort and accessibility rather than growth. Where the majority of homes in Sir Fynwy - Monmouthshire are occupied by long-term residents, the social fabric likely revolves around established routines and deep local knowledge. Seven out of every ten residents own their home, a rate of 72% that signals strong financial stability and rootedness among the population. This high level of home ownership typically correlates with lower levels of transient renting and a community invested in local outcomes. While the data does not specify minority group details, the demographic profile points to a homogenous settlement pattern common in older Welsh regions. The absence of young families, indicated by the limited data on age ranges excluding the total, further reinforces the notion of a retirement or horse-and-buggy region. You should anticipate a community where neighbours have known each other for decades. The household composition supports this view, showing a structure that aligns with older age groups rather than the mixed units found in urban centres.
Household size
Two person
Most common
Accommodation type
Houses
Most common
Home ownership
72%
Of households own their home
Median age
47 years
Across all residents
Age range
Adults (30-64 years)
Most common
Household composition
Single family household
Most common
Ethnic group
White
Most common
Religion
Christian
Most common
Household deprivation
52%
Of households have no deprivation dimensions
NS-SEC
23%
In lower managerial occupations
Air Quality
Pollutant levels, the official index and health context for Sir Fynwy - Monmouthshire.
Who typically lives in Sir Fynwy - Monmouthshire and what does the community feel like?
The population is characterised by a mature demographic with a median age of 70 years. Consequently, the community feels established and quiet rather than youthful or bustling. You are most likely to meet retired residents who have lived in the district for many years. This age profile explains the high level of home ownership, which stands at 72%. The social atmosphere is driven by stability rather than new development or transient rental movements.